

jQuery and its plugins for online applications
Selection of jQuery and other plugins to build professional web applications.The JQuery Ajax framework is the most used. This does not make it the only choice, there are others which also have their advantages, but it helps to have a lot of plugins that extend its capabilities.
What interests us here are extensions to help make online applications for business.
List of plugins
Inserting a spreadsheet into a web page ... By combining this JavaScript framework with a table you create an interactive and dynamic spreadsheet by updating data, customization of values according to user request. You can also use DataTable that has similar functions, or for a real spreadsheet, Ethercalc by Dan Bricklin the co-inventor of the spreadsheet.
Check compatibility with all browsers, especially on mobiles.
It is a set of plugins that facilitate interaction between user and application. This includes a calendar that appears when you have to give a date, form objects, user interface functions such as drag and drop, and many others.
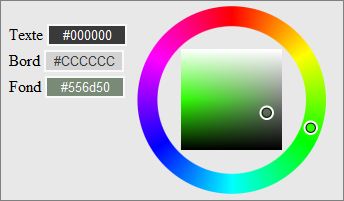
Some of these functions are now provided by HTML 5 but not on all browsers. Canvas is required by the colorpicker, HTML 5 is therefore essential, but the implementation of canvas is broader than some functions.
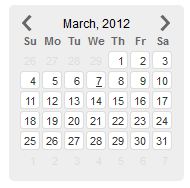
To choose a date and fill an input field, from a calendar.
Charting
There are many graphing libraries for jQuery, line charts, bars or pie charts. I tried Flot in production and I appreciate the opportunities we have to customize all aspects of the graph. It is fairly easy to use.
It is not without drawbacks, however. The use of dates as data series is unnecessarily complicated, although it is a fairly common use.
We find an alternative to Flot in Flotr2 which removes the dependency to jQuery and provides a lighter code.
The simplest framework to make graphs is Sparkline. Simply insert in the page a list such as <span>1, 2, 3, 4, 5 </span> and call a function with the identifier of this element to obtain a graph in Canvas. Peity has less functions but make pie charts, and it is rather a gimmick.
These libraries do not support IE prior to version 9. Another complete library that add this support is gRaphael. You can not not name D3.js a framework to visualize data in a variety of forms, a file of large size but correspondingly very complete. However it will take time to learn to use it.
Another method again is to generate graphs online as an image and insert the image in your page. See Canvas on this site.
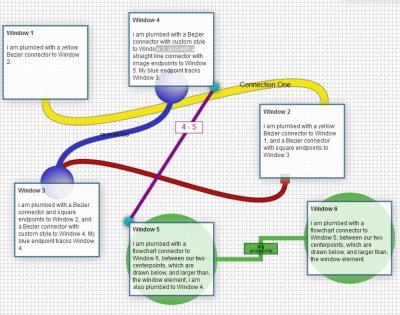
To create graphs composed of cards connected by pipes, as shown in the image ... There is a version for Mootools and YUI.
Widgets
And to complete a GUI, some widgets ...
- jQuery++. Collection of subroutines to help building an application.
- Star rating. Allows visitors to vote by converting radio buttons in stars. Note that there is no backend, we must create code to verify that a person does not vote more than once.
- MarkItUp. Transform a simple <textarea> tag into a text editor, with icons, HTML features, ...
- Farbtastic Color Picker. An interesting widget, but only demos to put the widget in a page, none on its use.
- Face detection. A jQuery plugin for face recognition based on the Liu Liu's algorithm.
- Parsley.js is a simple form validator to avoid you write the code for your interface, possibly with a server-side complementary code specific to the application.
There are also many widgets that do not require jQuery, and can work along with it.
See also
- New attributes of HTML 5. HTML 5 provides tools for advanced forms, but compatibility is yet to come as evidenced by the implementation checks.
- Canvas widgets.
Documentation