

How to know the traffic of a website with Alexa
A question that often arises: how to estimate the number of visits that receives a website? The PageRank represented by a green bar in the Google toolbar is far from being representative of traffic to a site. To be better informed, we need to go further and install the extension for Firefox Search Status. This displays in the bottom right the Alexa indicator, which gives the position of a site on the Net.
Update December 9, 2021 : Alexa.com is closed startring on May 1, 2022.
What is Alexa?
Alexa is a search engine that records visits to each site from its toolbar, which must be installed on the Internet browser. The statistics shown are updated every week.
Using Search Status, we know the position of a site on the Web by moving the mouse on the blue bar, it displays a numerical value that is the rank of the site on the Web. For more details, you go on the site of Alexa, click on "Traffic Ranking" at the top of the screen, you enter a domain name and click on "Get details."
Alexa is also at the origin of archives.org that stores all websites over time, and it was bought by Amazon in 1999.
How to interpret the values given by Alexa?
Search Status displays a blue bar, which represents the average position
for the past three months. This is the rank and is given primarily on the
Alexa panel .
The traffic rank is a geometric mean of the number of unique visitors and
the number of page views.
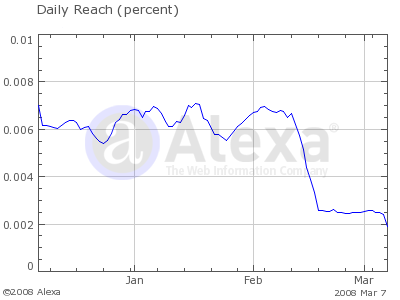
Then the page width is occupied by a graph, whose peried may be defined (six months in the example below), which represents changes in position. The value in the y axis is the percentage of visits for a site on Internet. By giving multiple site names, we can compare the curves.
Three tables are then drawn up over three periods: the last day, last week,
and the last three months (here we retrieve the value at top of the panel),
with also changes as compared with the previous three months.
The last column (3 ms change) show the difference between the last three months
and the three previous three months.
The first table shows the percentage of users of the Alexa toolbar who visited
the site.
The following is the rank of the site on the Internet for its traffic.
The third table provides the number of pages viewed by visitors for the same
periods.
Then are given the visitors by country as a percentage of the total number of visits, the rank in each country, and the distribution for subdomains if there is ones.
Assessing traffic of a website
The traffic is a logarithmic function of the position. In fact to get closer
to the top it is necessary that the traffic increases exponentially. To pass
from the rank 400000 to the rank 200000, for example, one must not double
the traffic, but triple it (this is an example, not an exact ratio).
In fact you need to properly assess the traffic statistics by comparing with
a site of the same rank. Yet the comparison is valid only if both sites have
a high rank. You can not use Alexa in connection with the acquisition of a
site based on traffic, because it is very easy to manipulate those numbers,
either by visiting the site frequently with the Alexa toolbar installed, or
by using a script. You should rather ask the person who sold the site the
statistics to evaluate it, and you should verify the origin of traffic.
The limitations of the system
According to the search engine Alexa itself, values given are more relevant as the number of visitors is more important. In fact only the first 100000 sites have a graph displayed because it is estimated that the lower values are unreliable.
Moreover statistics come from the Alexa toolbar, which must be installed. The theme can influence. Certain categories of netsurfers use rather the Google toolbar and visit more often some sites whose position is undervalued.
In fact, Matt Cutts from Google noted in his experience Alexa data are biased because there are many webmasters who install the Alexa toolbar. Accordingly his own website which mainly concerns webmasters displayed traffic unrelated to reality.
The graph therefore allows only to compare sites in the same topic.
By conducting a comparison of the CMS by popularity, using the siteinfo tool of Alexa, I found myself faced with a mystery, the extraordinary surge of popularity of some sites in January 2009 (end of March for some), as if they were all out of the sandbox at the same time!
Example with wordpress.org:
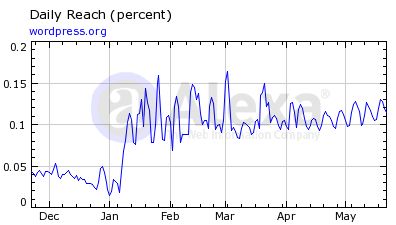
And the same sudden rise for Drupal, Joomla, phpBB!
Is it the algorithm of Google that has suddenly changed, or is it not ... the algorithm of Alexa instead? To find out, I continued the research using this time Google Trends for Websites (this service is no longer available).
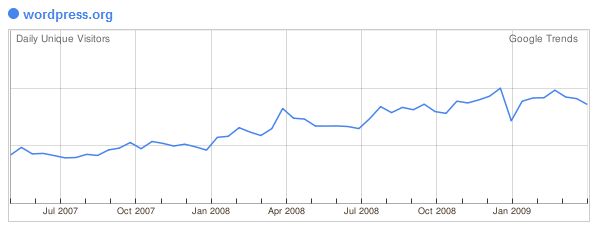
No more leap forward in January this time! What is the explanation of the mystery? Either the correction of a bug or a modification of the algorithm.
But as the General Semantics, popularized by A. E. Van Vogt, likes to repeat, the map is not the territory, and the Alexa graph does not change the traffic on a site!