

Circle, arc and pie chart, with JavaScript and Canvas
Algorithm to draw a pie chart with labels, using HTML 5 and some trigonometry.
To draw a simple circle, we use the canvas arc method with a 2 * PI length.
<script>
function circle()
{
  var canvas = document.getElementById("canvas1");
  var context = canvas.getContext("2d");
  context.beginPath();
  context.lineWidth="2";
  context.arc(100, 100, 90, 0, 2 * Math.PI);
  context.stroke();
}
circle();
</script>
The canvas has a size of 200 x 200 pixels.
The center of the circle is at x = 100, y = 100, given by x and y arguments of the function arc.
The radius of 90 pixels is the third argument. The third and fourth arguments give the starting angle, 0 and the final angle, twice PI.
We can ignore the argument about the direction of rotation that is superfluous here.
The circle can be filled with the fill method
To fill the circle, we add a fill instruction to the previous code, but also we assign the fillStyle attribute to define the color.
The stroke function may be kept to add a border or be omitted for a colored circle only.
Just as we created the fillRect method to draw a filled rectangle, we define a fillCircle function to obtain a filled circle.
function fillCircle()
{
  var canvas = document.getElementById("canvas2");
  var context = canvas.getContext("2d");
  context.beginPath();
  context.fillStyle="#FF4422"
  context.arc(80, 80, 70, 0, 2 * Math.PI);
  context.fill();
}

fillCircle();
Creating a pie chart
To create a chart consisting of circular sectors or "pie chart ", we creating these sectors with the arc, lineTo and fill methods.
- To distribute the value on the chart, we first calculate the sum of the values. Each arc is proportional to a statistical value as a percentage of PI * 2, which is the circumference of the circle.
- Each arc is delimited by a first position that is the end of the previous arc, to a new position which corresponds to 2 * PI * value / total.
The pie is made by these arcs, we do not draw a circle at start. - We must add a correction if we want the first sector on top, then we deduce PI / 2 which corresponds to a quarter of the circumference.
- A line is drawn following radius from the center to the latter position. As the arc it is actually invisible on the chart because it has the same color as the sector.
In fact, as we have just drawn the arc, a moveTo function is useless, we just continue the line from the circumference to the center of the circle with lineTo. - The sector is filled of the color assigned to it, with the fill method. We choose the colors in an indexed list.
Example:
Source code
function pie(ctx, w, h, datalist)
{
  var radius = h / 2 - 5;
  var centerx = w / 2;
  var centery = h / 2;
  var total = 0;
  for(x=0; x < datalist.length; x++) { total += datalist[x]; };
  var lastend=0;
  var offset = Math.PI / 2;
  for(x=0; x < datalist.length; x++)
  {
    var thispart = datalist[x];
    ctx.beginPath();
    ctx.fillStyle = colist[x];
    ctx.moveTo(centerx,centery);
    var arcsector = Math.PI * (2 * thispart / total);
    ctx.arc(centerx, centery, radius, lastend - offset, lastend + arcsector - offset, false);
    ctx.lineTo(centerx, centery);
    ctx.fill();
    ctx.closePath();
    lastend += arcsector;
  }
}

var datalist= new Array(35, 25, 20, 12, 7, 1);
var colist = new Array('blue', 'red', 'green', 'orange', 'gray', 'yellow');
var canvas = document.getElementById("canvas3");
var ctx = canvas.getContext('2d');
pie(ctx, canvas.width, canvas.height, datalist);
Values are stored in the datalist array and colors in colist. The two array are scanned together in the function pie() to create successive sectors according to the successive values and colors. Note: Do not use the function for (x in array), it does not work.
It is possible to flatten the graph to create a 3D effect, with the scale function, see the article on ellipse.
The code has been tested with all browsers supporting Canvas.
Labels on the pie chart
Displaying labels beside the graph with their respective values is not so visually speaking as if these labels were placed directly on the graph.
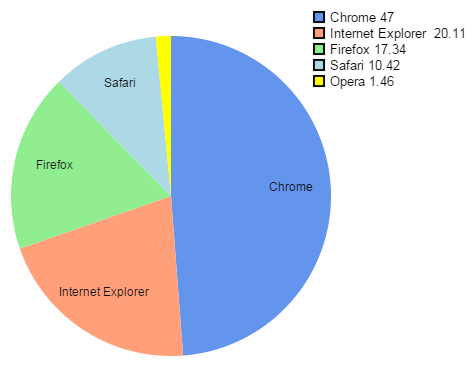
Example: Market shares of browsers in May 2015 from StatCounter.
With a little trigonometry, these labels can be positioned in the center of each part of the graph. Except when the parts are too small, it would become unreadable, so we just skip the labels.
Code source
function pie(ctx, w, h)
{
  var radius = h * 2 - 5;
  var centerx = w / 2;
  var centery = h / 2;
  var lastend = 0;

  var offset = Math.PI / 2;
  var labelxy = new Array();

  var fontSize = Math.floor(canvas.height / 33);
  ctx.textAlign = 'center';
  ctx.font = fontSize + "px Arial";
  var total = 0;
  for(x=0; x < datalist.length; x++) { total += datalist[x]; };

  for(x=0; x < datalist.length; x++)
  {
    var thispart = datalist[x];
    ctx.beginPath();
    ctx.fillStyle = colist[x];
    ctx.moveTo(centerx,centery);
    var arcsector = Math.PI * (2 * thispart / total);
    ctx.arc(centerx, centery, radius, lastend - offset, lastend + arcsector - offset, false);
    ctx.lineTo(centerx, centery);
    ctx.fill();
    ctx.closePath();
    if(thispart > (total / 20))
       labelxy.push(lastend + arcsector / 2 + Math.PI + offset);
    lastend += arcsector;
  }

  var lradius = radius * 3 / 4;
  ctx.strokeStyle = "rgb(0,0,0)";
  ctx.fillStyle = "rgb(0,0,0)";
  for(i=0; i < labelxy.length; i++)
  {
    var langle = labelxy[i];
    var dx = centerx + lradius * Math.cos(langle);
    var dy = centery + lradius * Math.sin(langle);
    ctx.fillText(datalist[i], dx, dy);
  }
}
The labelxy array was added to store the position of each label which is calculated when the graph is drawn. The text is placed after as it could overflow a sector.
When a portion of the graph - so a statistical percentage - is less than 1/20 of the total distribution, the label is not placed on the graph to avoid crowding text that would become unreadable. In fact, if a pie graph has too many small parts, the percentages would better be represented on a bar graph. Another chapter to add to this tutorial...
A demonstration of this algorithm is given by the online pie chart generator available on this site.