

Drawing a curve with Canvas
Canvas offers two powerful features for drawing curves, quadraticCurveTo and bezierCurveTo.
In the previous chapter, we have seen how to draw a line with Canvas. This is for a straight line, to draw a curve, two methods are offered.
1) The quadratic curve which is a parabola, thus an arc, possibly asymmetric. I has only one inflection point.
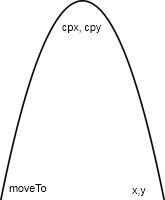
The starting point is given by moveTo(x, y).
The center of the curve depends on the control point cpx, cpy.
The end point is at x, y.
2) The bezier curve is a combination of arcs, it has at least two inflection points.
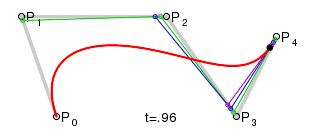
P0 is the entry point given by moveTo(x, y).
P1 is the control point cpx1, cpy1.
P2 is implied.
P3 is the control point cpx2, cpy2.
p4 is the endpoint x, y.
It is easier to chain curves such as ripples on the water with a Bezier function. A tree branch may have the shape of a parabola as a quadratic curve or the double curve of a Bezier function.
For this demo we will use a quadratic curve and it is drawn with the quadraticCurveTo function.
The plot of a such curve depends on three points, the starting point, the control point which marks the outer limit than met the curve and the ending point. The shape of the curve depends on the relationship between these three points.
The full syntax to obtain this curve requires three functions:
- beginPath starts a new curve.
- moveTo gives the starting point of the line.
- quadraticCurveTo has two pairs of argumenst: the control point ctx, cty where is reversed the direction of the curve, and the end point x, y.
You can specify the color and thickness with the same functions that were already used to draw a straight line:
- strokeStyle: color.
- lineWidth: thickness.
Demonstration
Full source code:
<canvas id="canvas1" width="400" height="150" style="border:1px solid #CCC"></canvas>

<script>
var canvas = document.getElementById("canvas1");
if (canvas.getContext)
{
  context = canvas.getContext('2d');
}

function drawCurve()
{
  context.beginPath();
  context.strokeStyle='red';
  context.lineWidth=4;
  context.moveTo(20,100);
  context.quadraticCurveTo(200,10, 300, 100);
  context.stroke();
}

drawCurve();

</script>
To see how the function uses the coordinates we also placed black dots at the three coordinates used to plot the curve ...
function drawDot(x, y)
{
  context.beginPath();
  context.fillStyle='black';
  context.arc(x, y, 4, 0, 2 * Math.PI, true);
  context.fill();
}
drawDot(20, 100);
drawDot(200, 10);
drawDot(300, 100);
We see that the curve does not reaches the checkpoints, the algorithm traces two imaginary straight line segments and a curve within these two segments without exceeding them.
You should also know ...
- To draw curves more accurately, with multiple inflection points, you can use a micro-framework such as Smooth.js. An interactive demo show how to convert lines to curves.